After the operation of the oil and gas recovery system, the detection data serves as the primary basis for judging the performance of the system. However, whether the data can indicate a problem depends on how it is read: looking at the emission concentration value alone is of limited significance. Only by combining the emission concentration, recovery volume, and equipment operation records can the true state of the system be discerned. Below, we summarize the interpretation approach from three perspectives for daily management reference.
Level 1: Focus on the trend of emission concentration rather than individual points
Emission concentration is the most directly concerned indicator in environmental management. When interpreting, two points should be noted: First, it is important to understand the testing conditions. Different gas source conditions and different operating states during testing will result in differences in the values themselves, and the comparability of single-point values is limited. Second, it is important to observe trends. The direction of change in values from consecutive measurements at the same point is more indicative of whether the system is deteriorating than the absolute values. A gradual increase in values usually indicates a decline in the recovery process, while sudden jumps in values are often related to equipment malfunctions or abnormal operations.
Steps for interpreting concentration data
- Check the operating condition records during inspection: whether the gas source temperature, operating status, and equipment operation mode are consistent;
- Arrange historical data in chronological order, first examining the trend and then the absolute value;
- When the value increases, conduct troubleshooting in stages according to the sequence of "collection - condensation - purification";
- When there is a sudden jump in numerical values, priority should be given to checking the equipment fault alarms and operation records;
- After disposal, conduct a retest and comparison to confirm whether the measures are effective.
Level 2: The amount of recycling should be reconciled with the amount of input
The recovery amount is merely a number when viewed in isolation. Only when it is placed alongside the oil or solvent consumption and procurement amounts for the same period for material balance can we determine how much has actually been recovered by the recovery system and how much remains unrecovered. If the recovery amount decreases while the consumption remains unchanged, it indicates a decline in system efficiency; if both consumption and recovery increase simultaneously, it may be a normal change brought about by increased production. Reconciliation of accounts on a weekly or monthly basis can identify deviations more promptly than a one-time reconciliation at the end of the year.
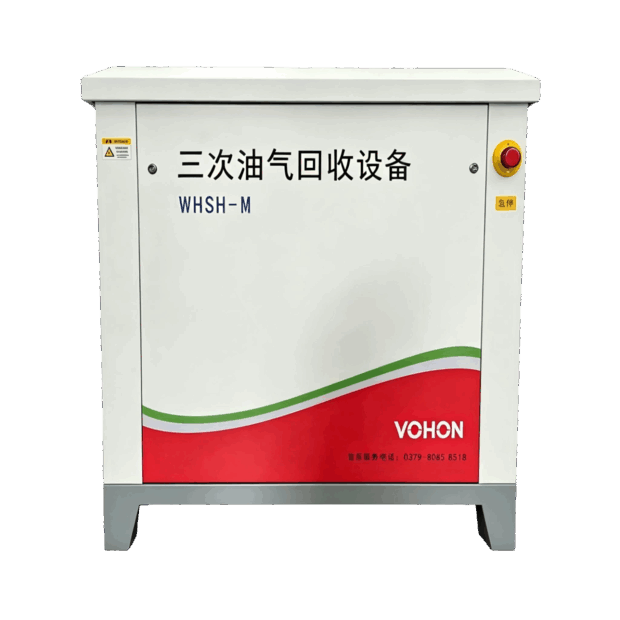
Key points of recycling quantity reconciliation
- Establish metering records for recovered solvents or oils, and specify the metering points;
- Record the usage, purchase, and inventory changes for the same period to generate a material balance sheet;
- Calculate the proportion of recycled materials to the total materials used, and observe its trend of change;
- When the proportion decreases, cross-check it with the concentration data to determine whether it is due to insufficient collection or degradation of the recovery unit.
Layer 3: View the actual status of equipment through operation records
The start-stop records, fault alarms, and key operating parameters (such as condensation outlet temperature, vacuum degree, inlet and outlet pressure difference, etc.) of equipment belong to process data. The value of these records lies in explaining the phenomena observed in the previous two layers: whether the concentration rise is due to high condensation temperature, whether the decrease in recovery volume is due to the equipment not recovering after a certain fault, and whether the equipment was actually running during the inspection. By placing process data and inspection data on the same timeline, many questions can be located without on-site inspection.
The relationship between data at three levels
| Data level | What does it reflect | Troubleshooting direction in case of anomalies |
|---|---|---|
| emission concentration | Does the purification effect meet the management requirements | Recycling unit processing capacity, equipment operating status |
| Recycled quantity / Material balance | How much has the system actually recycled | Collecting data on pipeline network integrity and condensate metering |
| Operation records and process parameters | Was the equipment operating normally at that time | Parameters such as temperature, vacuum degree, pressure difference, etc |
Frequently Asked Questions
If all the test values are qualified, do we just ignore them?
The qualified numerical values indicate that the purification effect at the time of testing meets the requirements. However, whether the system is experiencing slow degradation needs to be determined by combining trend analysis and material balance. Only by combining the two can a reliable conclusion be drawn.
When data anomalies occur, should we first check the equipment or the process?
It is recommended to first check the equipment operating status and operation records, and confirm that there are no abnormalities on the equipment side before investigating the collection pipe network and process side. The investigation sequence should be arranged according to the principle of "small investment, quick return".
How long should the operation records be kept?
In accordance with local management requirements and internal corporate policies, the standard practice is to archive inspection reports, operation logs, and maintenance records together, covering at least one complete equipment maintenance cycle.
This article is compiled by Luoyang Wohong Petrochemical Equipment Co., Ltd. The company provides design and manufacturing, skid-mounted customization, installation and commissioning, as well as after-sales operation and maintenance services for three-time oil and gas recovery equipment to gas stations and oil depots. If you need on-site inspection or scheme configuration, please feel free to contact us for discussion.